Where now for inflation?
Today the Bureau of Labor Statistics (BLS) released data showing that the rate of inflation for October was 0.4%. This was the same as the rate for September; even so the media claimed that, as CBS News put it, “Inflation eased in October as prices rose 7.7% from a year ago.”
The Consumer Price Index (CPI) tells you what has happened to inflation. What should we look at if we want to know what will happen to it?
I’ve written before about how our current inflationary problems are the result of the Federal Reserve printing trillions of dollars in a short space of time which it used to buy government and private sector financial assets when COVID-19 hit so as to keep the prices of those assets up and the cost of borrowing down.
Figure 2 illustrates this. It shows a sharp rise in the rate of growth of the Monetary Base. This comprises “total balances maintained plus currency in circulation” and is the portion of the money supply which is most directly under the control of the Federal Reserve. It expanded as the Fed printed money and used it to buy assets. As that new money found its way into the financial system, it became the basis for a rapid expansion of M2, a broader measure of the money supply comprising “M1 plus (1) small-denomination time deposits (time deposits in amounts of less than $100,000) less IRA and Keogh balances at depository institutions; and (2) balances in retail MMFs less IRA and Keogh balances at MMFs.”
Figure 1: Monetary Base and M2, % change from a year ago
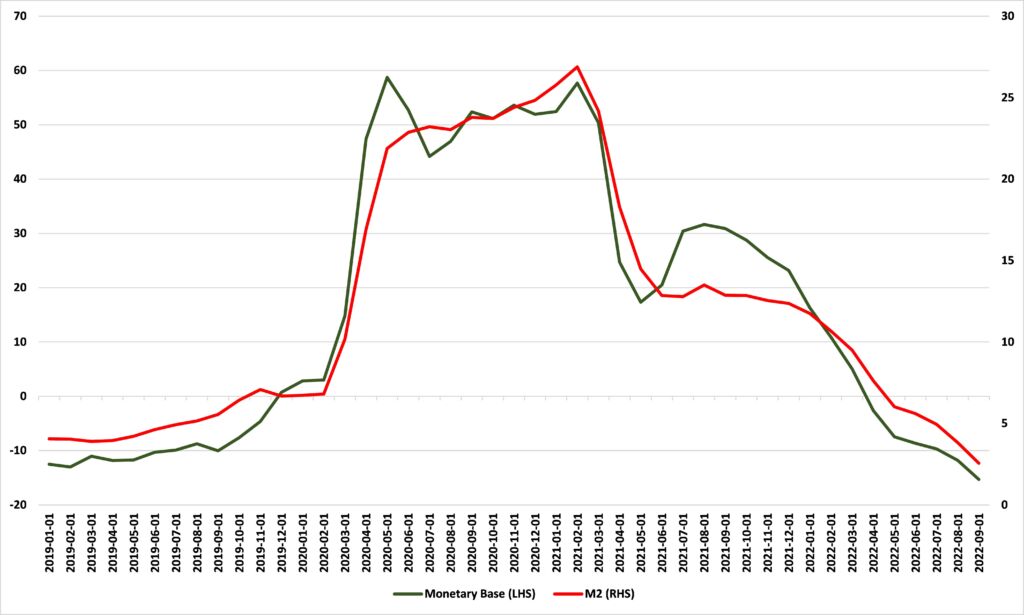
M2 is the money supply measure more closely tied to inflation as measured by changes in the CPI. As the amount of money increases relative to the goods and services available for it to be spent on, the prices of those goods and services is bid up: inflation.
But this process takes some time. How long? The peak annual rate of M2 growth was 26.9% in February 2021. The peak annual rate of CPI growth was 9.0% in June 2022, sixteen months later. If we push the data for M2 growth forward sixteen months so that the peaks match, as we do in Figure 2, we see another close fit. Inflation, as measured by the CPI, has been driven by expansion of the money supply, as measured by M2.
Figure 2: M2 and CPI, % change from a year ago, M2 leading by 16 months
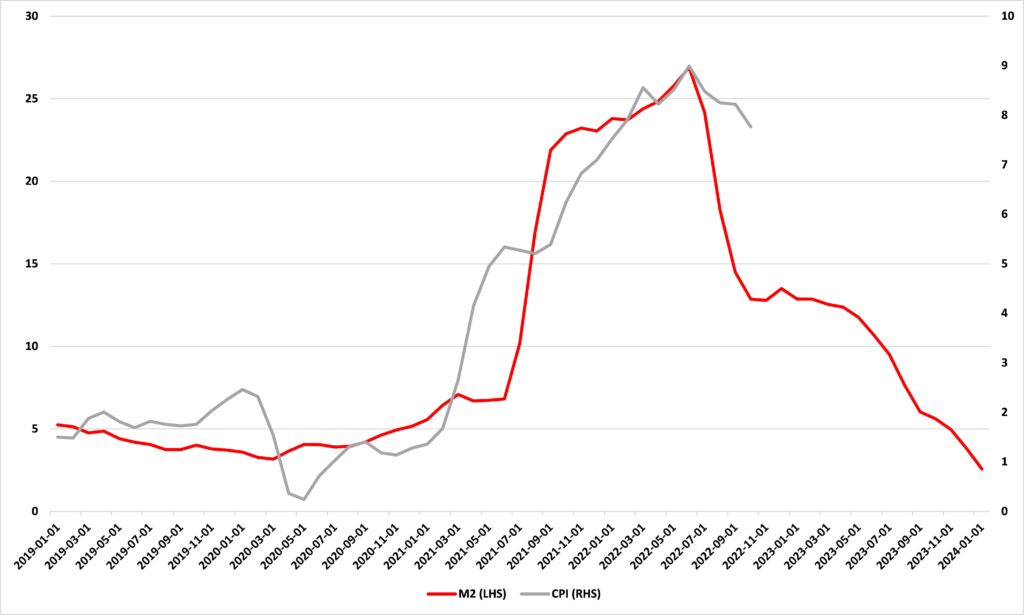
The relationships above give us a good basis to speculate on where inflation might be headed. The answer is ‘down’, and, perhaps, reasonably sharply. The rate of M2 growth is now back where it was before the pandemic. If this drives CPI growth, as the data suggest, then we can expect inflation to return to its pre-COVID-19 rate over the next sixteen months or so.
I’ll look at what this might mean for the economy next week.