What’s behind the GDP numbers?
Yesterday, the Bureau of Economic Analysis (BEA) announced that:
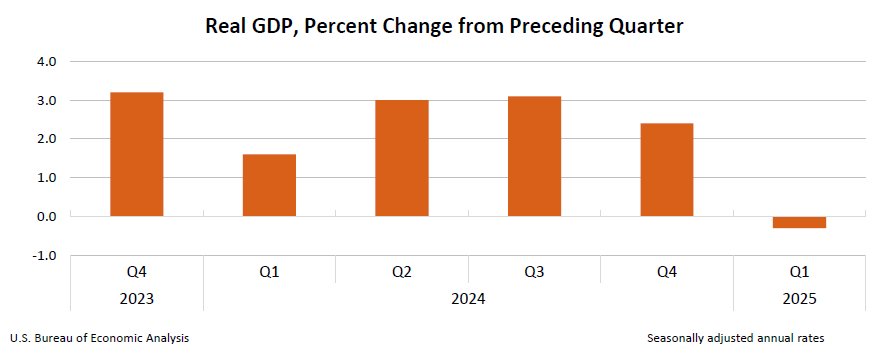
Real gross domestic product (GDP) decreased at an annual rate of 0.3 percent in the first quarter of 2025 (January, February, and March), according to the advance estimate released by the U.S. Bureau of Economic Analysis. In the fourth quarter of 2024, real GDP increased 2.4 percent.
Not great news, obviously, you’d rather have GDP increasing than decreasing. But these were pretty wacky numbers, and its worth looking a little more closely at a couple of points.
It’s the imports, stupid
First, what drove this fall in real GDP?
To quantify domestic production of goods and services, GDP measures spending and this typically falls into four categories: personal consumption expenditures (C); gross private investment (I); government purchases (G); and net exports (X – M), composed of exports (X) minus imports (M). If you’ve studied macroeconomics at any level, you’ll probably recognize this equation:
GDP = C + I + G + (X – M)
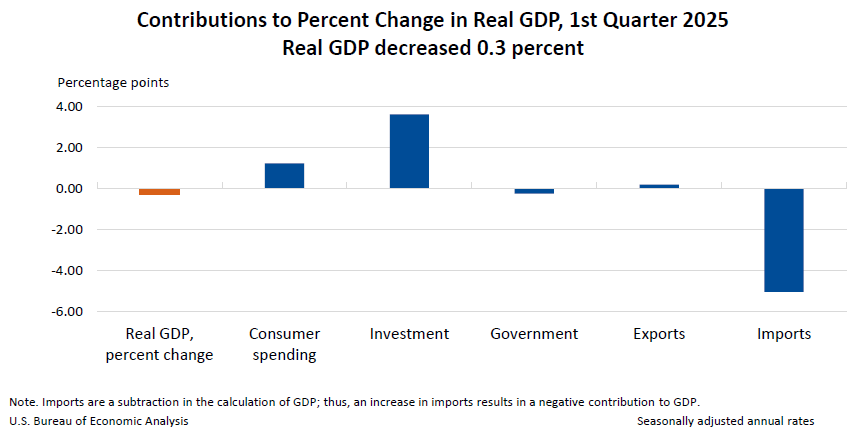
The BEA breaks down the changes in real GDP into the changes in these categories:
The decrease in real GDP in the first quarter primarily reflected an increase in imports, which are a subtraction in the calculation of GDP, and a decrease in government spending. These movements were partly offset by increases in investment, consumer spending, and exports…
Compared to the fourth quarter, the downturn in real GDP in the first quarter reflected an upturn in imports, a deceleration in consumer spending, and a downturn in government spending that were partly offset by upturns in investment and exports.
Of the four categories, the figures in Q1 2025 were in the ballpark of the average over Q1 2017 to Q4 2024 for two. The figure for “Personal consumption expenditures” (C) — 1.8% — compares to an average of 3.2%, and for “Government consumption expenditures and gross investment” (G), the figure of -1.4% — DOGE doing its work? — compares to an average of 2.1%.
For the other two categories, however, the figures are way off these averages. The figure for “Gross private domestic investment” (I) — 21.9% — compares to an average of 4.7%. If we break “Net exports of goods and services” down into its components, we find that, while the number for “Exports” (X) — 1.8% — compares to an average of 3.5%, the figure for “Imports” (M) — 41.3% — compares to an average of 5.1%.
This is why I describe these numbers as “wacky.” I am not saying they are cooked, but they are anomalies which are unlikely to be repeated.
I am not generally a fan of shopping around for data when there is a commonly accepted official series, as our local DFLers do when preferring methodologically dubious rankings from random bloggers to, say, state GDP or migration data. But Jason Furman, chair of the White House Council of Economic Advisers under President Obama, wrote this week of “core” GDP, “the figures that reflect consumer spending and private investment.” This shows up in the BEA data as “Real final sales to private domestic purchasers” and “increased 3.0 percent in the first quarter, compared with an increase of 2.9 percent in the fourth quarter.” The average over Q1 2017 to Q4 2024 was 3.3%, as Figure 1 illustrates.
Figure 1

Imports do not subtract from GDP
The second point is whether all this shows that we would be better off without imports.
That, after all, is what the GDP equation above seems to say: Imports (M) are subtracted. If you spend $45,000 on an imported car, the equation seems to imply that $45,000 should be subtracted from GDP.
But GDP is trying to measure domestic production, so imports — foreign production — should not be counted towards GDP. So, if you spend $45,000 on a foreign car that shows up in “Personal consumption expenditures,” but it is not domestic production so it has to be removed from GDP by subtracting the $45,000 in the “Exports” category. It is a question of accounting.
The layperson can be excused for this confusion. Some others really ought to know better.